Are you new to statistical analysis? Come in now and discover the popular statistical analysis methods you can use to analyze your data set and discover patterns, trends, relationships.
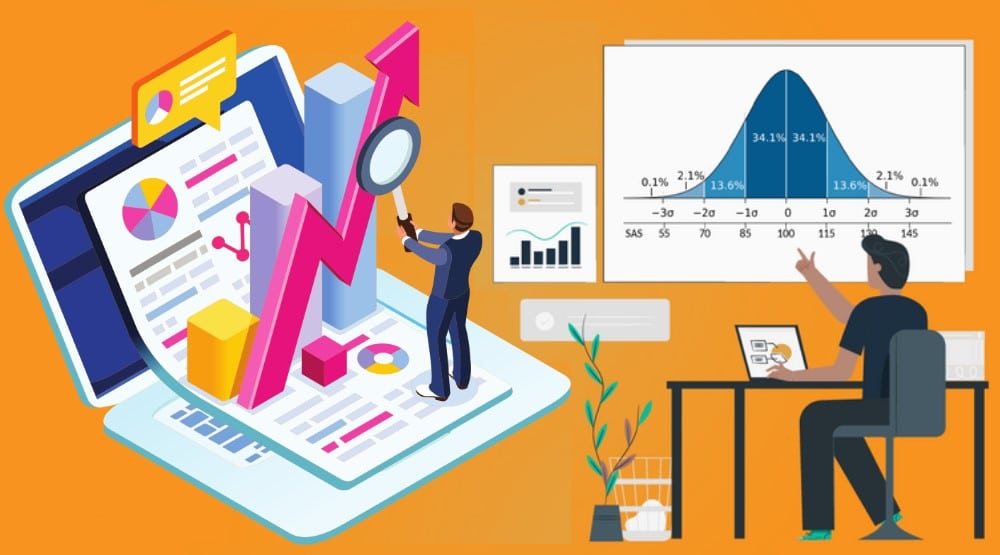
In the past, we were posed with the problem of the availability of data. This is no longer the situation. With the advent of technology, generating and compiling data is now easy, fast, and stress-free.
The problem has now shifted from the availability of data to what you use the data for. More than ever, humans and the devices they make use of generates more than 2.5 quintillion bytes of data daily. Even though the data set of interest to you is not anywhere near this number, I bet you won’t be able to draw any reasonable and valid conclusion by merely looking at a spreadsheet of data.
For you to get any insight from data, you will need to analyze it using statistical methods. In this article, you are going to be learning about statistical analysis and methods and how to use them to analyze data. Before moving into the discussion of the numerous statistical analysis methods, let take a look at an overview of statistical analysis.
What is Statistical Analysis?
Statistical analysis is the process of uncovering patterns and trends from a set of data. After a data set has been collected, one cannot make any sense from the heap of unprocessed data. A data collection is processed so that insights can be gotten from it, which can be used for making decisions. The processing of raw data to transform them into a more meaningful piece of information that can be acted upon is what is known as statistical analysis – the analysis of data to draw out statistical conclusions.

What can statistical analysis do for us? Statistical analysis can be used to summarize data, find key measures of location, otherwise known as a measurement of central tendency, calculate the measurement of spread, make future predictions, and test experiments. Statistical analysis is scientific in nature and interestingly being used in most scientific disciplines that deal with data, including the social sciences.
Statistical Methods Used for Statistical Analysis
When confronted with a set of data to carry out statistical analysis on, you will have to select the best statistical method to use for the analysis. There are many statistical analysis methods you can use on statistical data. Let take a look at some of these methods below.
Measurement of Central Tendency
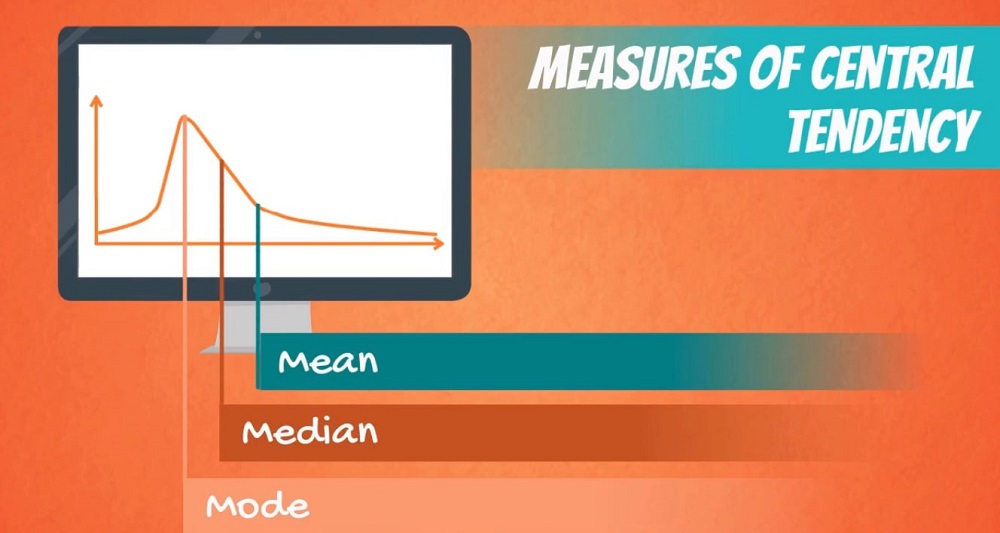
The measurement of central tendency is summarized statistics showing the center point of a dataset. These measures show where most values fall in a distribution. There are 3 methods for measuring central tendency – mean, median, and mode. You can use these 3 measures to locate the center of your data.
-
Mean
Also known as the average mean, the mean is the most popular measure of central tendency – and the one most data scientist and statisticians are used to. The mean is the sum of a list of numbers divided by the number of items on the list. While the mean is very easy to calculate, outliers can mess up your mean value. Using the mean only can be dangerous. If your data set is not a normal distribution but skewed, the mean is not the best.
-
Median
The median is simply the middle value. This value is the value that divides the data set into two equal halves. To find this value, arrange the values from the smallest to the largest and pick the middle value. The median is easy to calculate when the number of values is odd, as all you have to do is to pick the middle number. For a data collection with an even number of data set, you will have to pick the two in the middle and find the average. Unlike the mean, the median does not get affected by outliers and skewed data. The median is used for skewed distribution.
-
Mode
The mode measure of central tendency is used for categorical data, probability distribution, count data, and ordinal data. The mode is simply the value that appears the most in a collection of data. You can have more than one mode or not even a mode value in all.
Standard Deviation
While the measure of central tendency reveals the center point of a data set, the standard deviation reveals the measure of spread around the mean (central tendency). This statistical analysis method shows how much the members of a group differ from the mean value for the group. It is simply the deviation from the standard (mean). A low standard deviation shows that the values are close to the mean – which is the expected value. When the value for the standard deviation is high, this shows that there is a wide difference between the mean and the values.
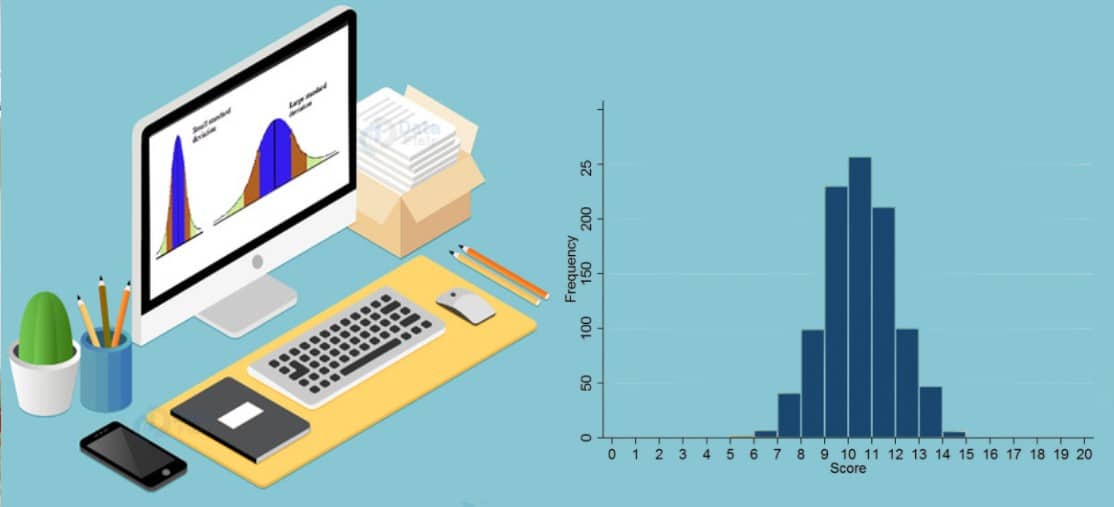
When you have a normal or near-normal distribution without outliers, the standard deviation can be trusted. But in situations where there are a large number of outliers and strange data patterns, then the value for the standard deviation can be deceptive and misleading and, as such, cannot be trusted.
Sample Size Determination
When dealing with a large population, it becomes difficult for you to take a record of all items in a population in other to carry out analysis on them. Fortunately, for us, a sample can provide an accurate estimate of what a population looks likes.
By strategically carrying out your research on a subsect of a population, you can get the required result should you use the whole population. The sample size, the subsect of a population you can use for your research, is not selected haphazardly – there are laid down rules you can use to determine the sample size for your research.

There are many ways in which you can decide the size of your sample. One of the ways in which you can determine sample size is by using the proportion and standard deviation methods. If you’re looking for a step by step guide on how to accurately determine sample size from a population, you can check out this guide on WikiHow on how to get it done. There’s no doubt about sample size being an important tool for research in situations where population size is large. However, you need to be careful when using it, especially when dealing with untested or new variables in a population. This is because you’ll be making an assumption which, if wrong, can mess up your result.
Linear Regression
Linear Regression is another very important statistical analysis method you should be familiar with. The regression model is used for showing the relationship between dependent variable values independent and independent variables, otherwise known as explanatory variables.
The dependent variable is your data of interest. Regression is used for determining the extent of change in a dependent variable with a change in an independent variable. Thisstatistical analysis can be used to answer questions such as what will be my monthly spending next year? How correlated is monthly income and standard of living?
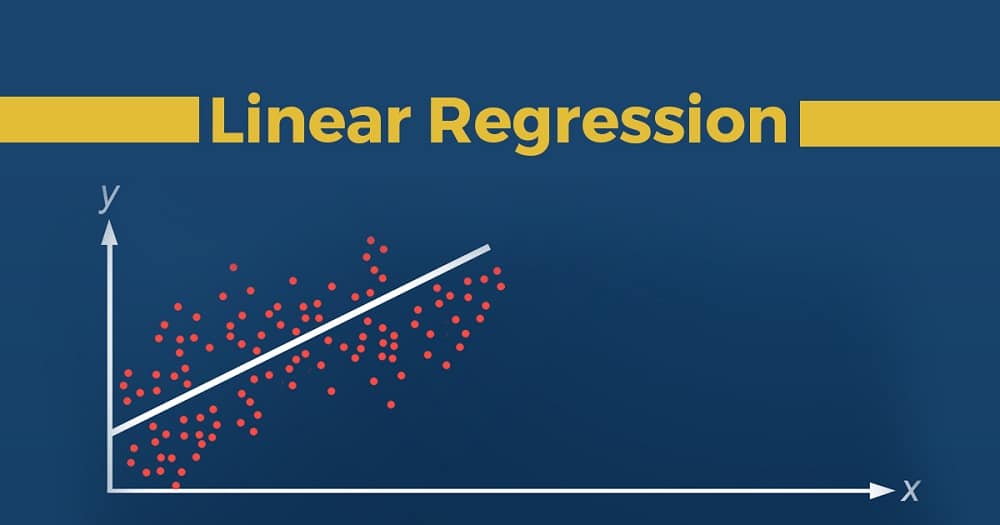
The relationship can be represented in a scatterplot chart. There are basically two types of Linear Regression –Simple Linear Regression and Multiple Linear Regression. Aside from the fact that regression analysis charts show how weak or strong the relationship between variables, regression charts can also reveal a trend/pattern over time and use for making data-based predictions.
However, you have to be careful when dealing with outliers in regression modeling. Outliers aren’t distinctive in regression. This then means that you’ll have to take note to avoid regarding important data points as outliers. Without making an effort, the chart will want you to disregard the outliers and focus on the other data points.
Classification
If you have a large dataset, you might want to consider classifying them into groups to make analysis effective. In statistical learning and Machine Learning, classification can be seen as the method of assigning classes to datasets in order to aid in more accurate predictions and analysis. This method is used mostly on a large collection of data.
Classification is sometimes known as a decision tree. There are basically two types of classification. There are basically two techniques to classification – Logistic Regression and Discriminant Analysis.
Logistic regression is a classification algorithm used when the value of the target variable is categorical in nature. Logistic regression is most commonly used when the data in question has binary output, so when it belongs to one class or another, or is either a 0 or 1. Discriminant analysis is a statistical technique used to classify observations into non-overlapping groups, based on scores on one or more quantitative predictor variables.
Hypothesis Testing
Another important statistical method you should know is hypothesis testing. Hypothesis testing is a statistical inference method used for statistical testing hypotheses. In statistics, there are basically two types of hypotheses. These include the null hypothesis and the alternative hypothesis. The null hypothesis asserts that no relationship exists among variables or that no change occurred over time.
The alternative hypothesis is simply a hypothesis statement that contradicts the null hypothesis. If a null hypothesis states that defendant A is not guilty, the alternative hypothesis statement will state that defendant A is guilty.
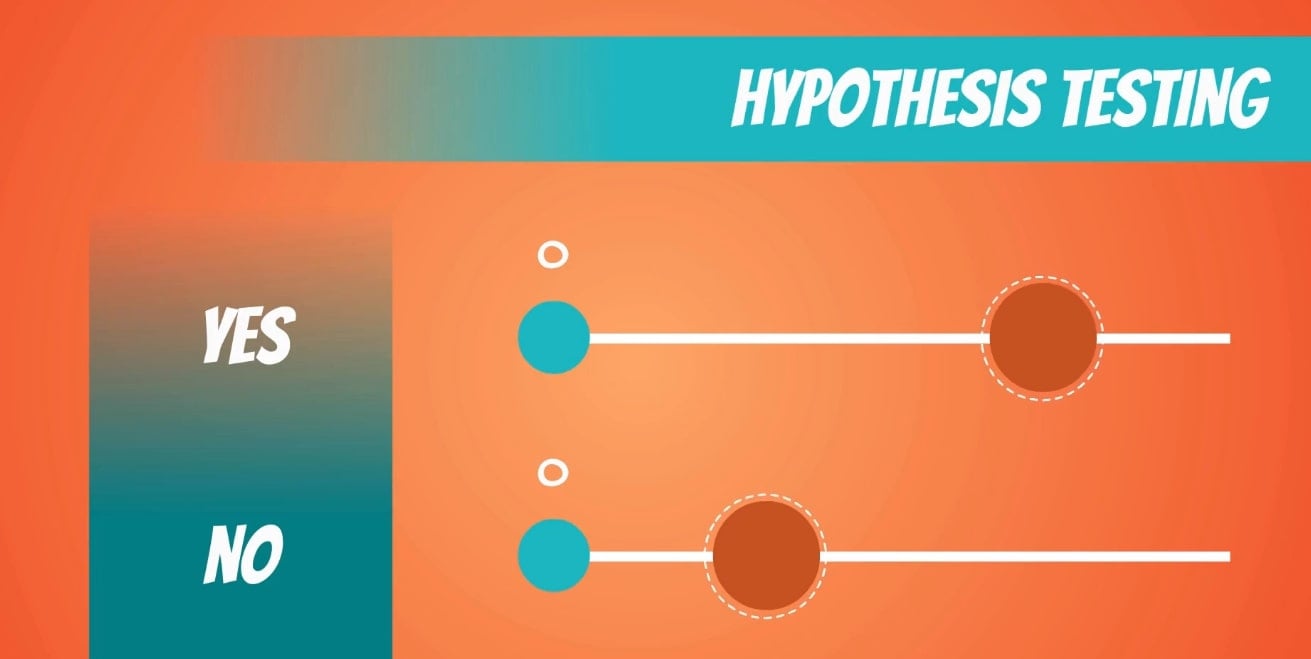
The null hypothesis is the status quo and remains until the alternative hypothesis is proven beyond a reasonable doubt, after which, the null hypothesis is rejected, and the alternative hypothesis is accepted. Failure to prove the alternative hypothesis and reject the null hypothesis could lead to a form of contradiction that will lead to further test for errors known as the Type II error. To learn more about hypothesis testing, read the statistical hypothesis testing page on Wikipedia.
Conclusion
Statistical analysis is actually very important. Without it, data is just data and nothing – you can’t make sense out of it. With statistical analysis methods, you can comb into data, breathe into it, discover patterns, and pinpoint trends. The methods above are some of the popular methods used for statistical analysis.
Related,


